JDKRUEGER&COAcademySign inDE
Module 2 of 4 · Google Analytics 4 for CRO

The Right Metrics for CRO Decision-Makers

⏱ 25 min · After completing this module, you'll be able to define a lean set of five decision-relevant GA4 metrics for your shop, consciously filter out vanity metrics, and use revenue per user as a segmented primary metric - rather than letting traffic and session numbers lead you astray.
← Google Analytics 4 for CRO The Right Metrics for CRO Decision-Makers 1 / 23
continuing in 5
Start

The Right Metrics for CRO Decision-Makers

Not every number in GA4 carries the same weight. Learn to focus on the metrics that actually drive your CRO decisions.

Focus on CRO-Relevant Metrics
Transcript of this slide

Welcome to the second module of the GA4 track. GA4 offers dozens of metrics. In this module, we'll separate what matters from what distracts and build a lean framework for decision-makers.

Learning objective

Learning Objective

decision metrics

  • You'll know the five GA4 metrics that matter most for CRO.
  • You'll define a lean reporting setup for your shop.
1
Spotting vanity metrics
2
Five key metrics
3
Building your report
Transcript of this slide

After this module, you'll ignore metrics that look good but change nothing. You'll focus on numbers that lead directly to action.

Concept

Vanity Metrics vs. Decision Metrics

Vanity metrics: page views, sessions, followers. They look impressive but tell you little about real business performance.

  • Decision metrics: conversion rate, RPU, drop-off rate, revenue per session. They show whether things are actually improving.
  • As a decision-maker, you need metrics that justify action.
Comparing Impact
Transcript of this slide

Most dashboards are packed with vanity metrics. They create a sense of activity without telling you whether the shop is actually getting better. Your job is to change that.

Concept

The Five GA4 Metrics for CRO

One: Conversion Rate. The share of visitors who complete the desired goal.

  • Two: Revenue per User or Revenue per Session. The revenue generated per visitor.
  • Three: Add-to-Cart Rate. The share of visitors who add a product to their cart.
  • Four: Checkout Abandonment Rate. The share of visitors who don't complete their purchase.
  • Five: Return on Ad Spend. The return on every euro spent on advertising.
1
CR
2
RPU
3
ATC
4
Drop-off
5
ROAS
Transcript of this slide

These five metrics cover the entire CRO funnel. They show whether you're convincing more users, whether those users are spending more, and whether your marketing is becoming more efficient.

Example

Example: Traffic Goes Up, Revenue Goes Down

A shop celebrates a 30% increase in sessions.

  • But the conversion rate drops by 25% and the average order value falls by 10%.
  • The result: more traffic, lower quality. No real improvement.
36 72 107 143 130 Sessions 75 Revenue
Transcript of this slide

This example shows why sessions alone mean nothing. Without looking at conversion rate and order value, you'd make the wrong call, like investing more in the traffic channel that's actually hurting you.

Concept

Why Revenue per User Is the Better Primary Metric

Conversion rate alone ignores order value.

  • Revenue per User combines conversion rate and Average Order Value into a single number.
  • For CRO decision-makers, RPU is often the most meaningful metric.
1
CR × AOV
2
= RPU
Transcript of this slide

RPU is the gold-standard metric for CRO. It tells you how much revenue you're generating per visitor. Improving your RPU almost always means improving your business.

Concept

Segment, Don't Just Aggregate

Aggregated metrics often hide the real levers.

  • The same conversion rate can be catastrophic on mobile and excellent on desktop.
  • Every decision metric should be viewed by device, source, and customer segment.
Aggregated vs. Segmented
Transcript of this slide

Averages are dangerous. They hide both problems and opportunities. When your team hands you a metric, always ask how it breaks down by segment.

Scenario

Scenario: Desktop Wins, Mobile Loses

A test shows an overall conversion rate increase of 5%.

  • Look closer and desktop is up 12%, but mobile is down 8%.
  • Without segmentation, you'd have rolled out a change that hurts mobile users.
4 7 11 14 5 Total 12 Desktop -8 Mobile
Transcript of this slide

This is a classic example of why segmentation matters. The overall number masks a mobile problem. In CRO, the segmented view is often more important than the average.

Concept

The Attribution Question

GA4 offers several attribution models.

  • The model determines which channel gets credit for a conversion.
  • As a decision-maker, you need to know which model your team is using and why.
1
Last Click
2
First Click
3
Data-Driven
Transcript of this slide

Attribution isn't a technical detail. It's a strategic decision. Depending on the model, the same purchase looks completely different. Make sure your team can justify the model they've chosen and applies it consistently.

Exercise

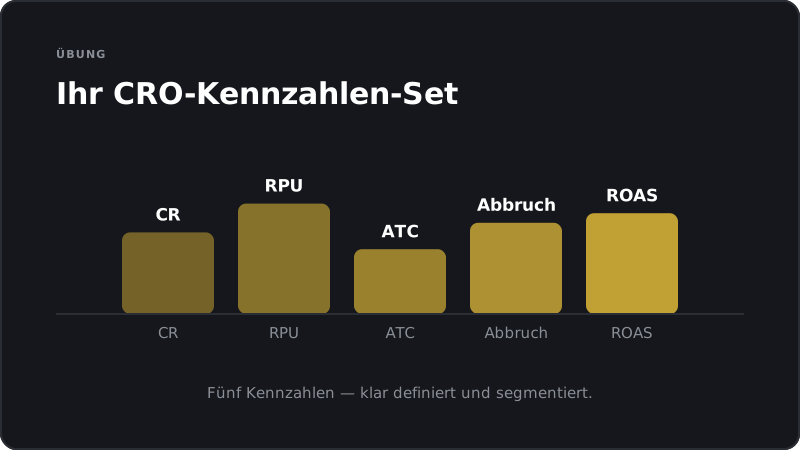
Exercise: Your CRO Metrics Set

Choose the five most important metrics for your shop.

  • For each metric, define who owns it and how often it's reviewed.
  • Rephrase as 'Decide which segments each metric must be broken down by at a minimum.'
Five metrics, clearly defined
Transcript of this slide

This exercise is the heart of the module. A lean, clearly defined set of metrics is more valuable than any sprawling dashboard. Take the time to define your five metrics.

Concept

Capitalize as 'Reading Funnel Metrics Correctly'.

View, Interest, Cart, Purchase

  • Each stage has its own conversion rate.
  • The biggest gap between two stages points to the next lever.
Funnel with gap identification
Transcript of this slide

Funnel analysis is the foundation of CRO prioritization. You don't need to optimize every stage equally. Focus on the stage with the biggest gap relative to the benchmark.

Example

Case study: The wrong primary metric

An online store spent months optimizing for page views per session.

  • The number went up, but the conversion rate dropped because users were getting lost.
  • Only after switching to RPU as the primary metric did the right actions get prioritized.
Page views vs. RPU
Transcript of this slide

This case study shows how the wrong primary metric can steer an entire team in the wrong direction. The metric shapes behavior, so choose it carefully.

Common misconception

Misconception: "More traffic is always good"

Reality: More traffic is only good if it's the right quality.

  • Low-quality traffic drives down your conversion rate, masks real improvements, and burns budget.
  • Less traffic with higher quality beats more traffic with a lower conversion rate.
Traffic volume vs. traffic quality
Transcript of this slide

Many online stores buy traffic that doesn't convert, then wonder why their KPIs are declining.

Concept

Reporting cadence for decision-makers

Daily: Only during active campaigns or tests.

  • Weekly: Core trends, anomalies, test status.
  • Monthly: Strategic review, benchmark comparison, roadmap update.
1
Daily
2
Weekly
3
Monthly
Transcript of this slide

Not every metric needs to be checked every day. A solid cadence prevents you from reacting to noise and ensures that strategic patterns don't get overlooked.

Concept

From report to decision

Every metric you look at should lead to one of three questions: What's happening? Why is it happening? What do we do about it?

  • If a metric doesn't answer any of those questions, it doesn't belong in your reporting.
  • Good reporting ends with a recommended action.
1
What?
2
Why?
3
What to do?
Transcript of this slide

Reporting is just a means to an end. The end is a decision. If your reporting doesn't deliver a clear recommendation, it's too descriptive and not decision-oriented enough.

Summary

Summary

Focus on CRO-relevant metrics, not vanity metrics.

  • RPU is often the strongest primary metric for CRO decision-makers.
  • Segmentation and funnel gaps reveal the real levers.
1
Focus
2
RPU
3
Segments
4
Funnel
Transcript of this slide

The key takeaway from this module: less is more. Five well-chosen, segmented metrics are more valuable than fifty numbers without context. Decisions need focus.

Summary

What you'll take away

Define your personal CRO metric set with no more than five numbers.

  • Always ask for segmented reports, never just averages.
  • Make sure every metric leads to a recommended action.
From data overload to decision-making power
Transcript of this slide

Focus, segment, and make every metric action-oriented. That's the framework.

Intermediate step

What's next

The next module covers how to turn GA4 data into concrete test hypotheses, the critical step from observing to testing.

Next module: From data to hypotheses
Transcript of this slide

In the next module, we connect data with action. Because the best metric in the world means nothing if you don't know what to test next.

Quiz

Quiz

Test your knowledge.

What distinguishes primary metrics from secondary metrics?

Why isn't it enough to look only at sessions and users?

What does 'checking measurability' mean when selecting metrics?

Which question is especially important when aligning KPI definitions with an agency?

What role do segments play in evaluating metrics?

Exercise

Exercise

Apply what you have learned right away.

  • 1
    Vanity Metric Audit
    worksheet · approx. 20 min
    List every metric you currently review on a regular basis. Label each one as either a vanity metric or a decision metric. Then cut at least three vanity metrics from your regular reporting.
  • 2
    Segmentation Check
    audit · approx. 20 min
    Pick your most important conversion metric. Have your team pull the numbers for at least three segments: device, traffic source, and new vs. returning customer. Identify the segment with the biggest deviation.
Reflection

Reflection

A quick look back before you continue.

  • Which metric in your current reporting is a vanity metric that signals activity but never drives a decision - and why are you still looking at it?
  • If you could only run your shop based on revenue per user: which segment would immediately stand out as a problem or an opportunity?
  • Which funnel stage in your shop has the biggest gap to the benchmark - and would therefore be your next optimization focus?
Finish

Module completed

Next module: From GA4 data to test hypotheses

Hands-on material to take away

This module comes with two PDF downloads you can apply right away:

  • Job-Aid: The core message condensed onto one page, ideal for quick reference before decisions.
  • Worksheet: A fillable worksheet to adapt what you have learned to your shop.

Overview & learning objective

This module is aimed at shop owners.

After completing this module, you'll be able to define a lean set of five decision-relevant GA4 metrics for your shop, consciously filter out vanity metrics, and use revenue per user as a segmented primary metric - rather than letting traffic and session numbers lead you astray.

Prerequisites: GA4 as a Decision-Making Tool
The Right Metrics for CRO Decision-Makers